How to Use Leveraged Dividend Capture (DNDC)
A step-by-step guide to the Delta-Neutral Dividend Calendar: harvest RWA-perp dividends on Aster while hedging on Lighter, and read the leverage-amplified return on every upcoming payout.
Leveraged Dividend Capture — internally the Delta-Neutral Dividend Calendar, or DNDC — tracks the dividends paid on tokenized-stock perpetuals that trade on both Aster and Lighter, and shows the return you'd earn by capturing each one with a delta-neutral, market-neutral position. Where the Funding Rate Scanner and Cross Exchange Funding Arbitrage tools harvest funding, this tool harvests dividends — a source of yield that no ordinary dividend calendar (Nasdaq, TradingView, investing.com) connects to on-chain perps.
This guide explains the strategy in plain terms, then walks through every tab so you can read the calendar, the instrument universe, and the track record of payouts that have actually landed.
The Idea: A Dividend You Can Hedge
A tokenized-stock perpetual (an "RWA perp") doesn't give you ownership of the share and usually pays no dividend of its own. But the economics of the dividend still reach the perp — and each exchange handles them differently. That difference is the edge.
The anchor fact: Aster pays the dividend directly to the long side of a tokenized-stock perp — as a separate credit, not baked into funding. Aster announces each payout in its own announcements two to three days ahead, stating the exact amount and date, and those match the dividend the underlying stock actually pays.
The position is a two-venue pair:
Because the two legs are equal in size and opposite in direction, price direction doesn't matter: a move up costs you on the Lighter short and pays you on the Aster long, and they cancel. What's left is the dividend Aster pays the long — on top of the hedged price move. The classic dividend-capture trap (the stock drops by the payout right after the ex-date) doesn't bite you here, because that drop is offset on the opposite leg.
Why Leverage Turns a Small Dividend Into a Real Return
A dividend is a fraction of a percent of the share price — tiny on its own. Leverage is what makes it worth doing.
The dividend is paid in dollars on the notional (the full position size). But the capital you actually put up is only the margin on each venue — a fraction of that notional. So the return on your capital scales with the effective leverage of the pair:
Worked through on the ORCL settlement from the History tab: a $0.50 dividend was a 0.35% unleveraged yield, and at a 6.7× effective leverage that became a 2.30% return on capital — for a single payout, with the price move hedged out. The leverage risk here is liquidation risk on one leg, not price risk (price is hedged) — which is why you size leverage for survivability, not for the biggest headline number.
What You'll See When You Open the Tool
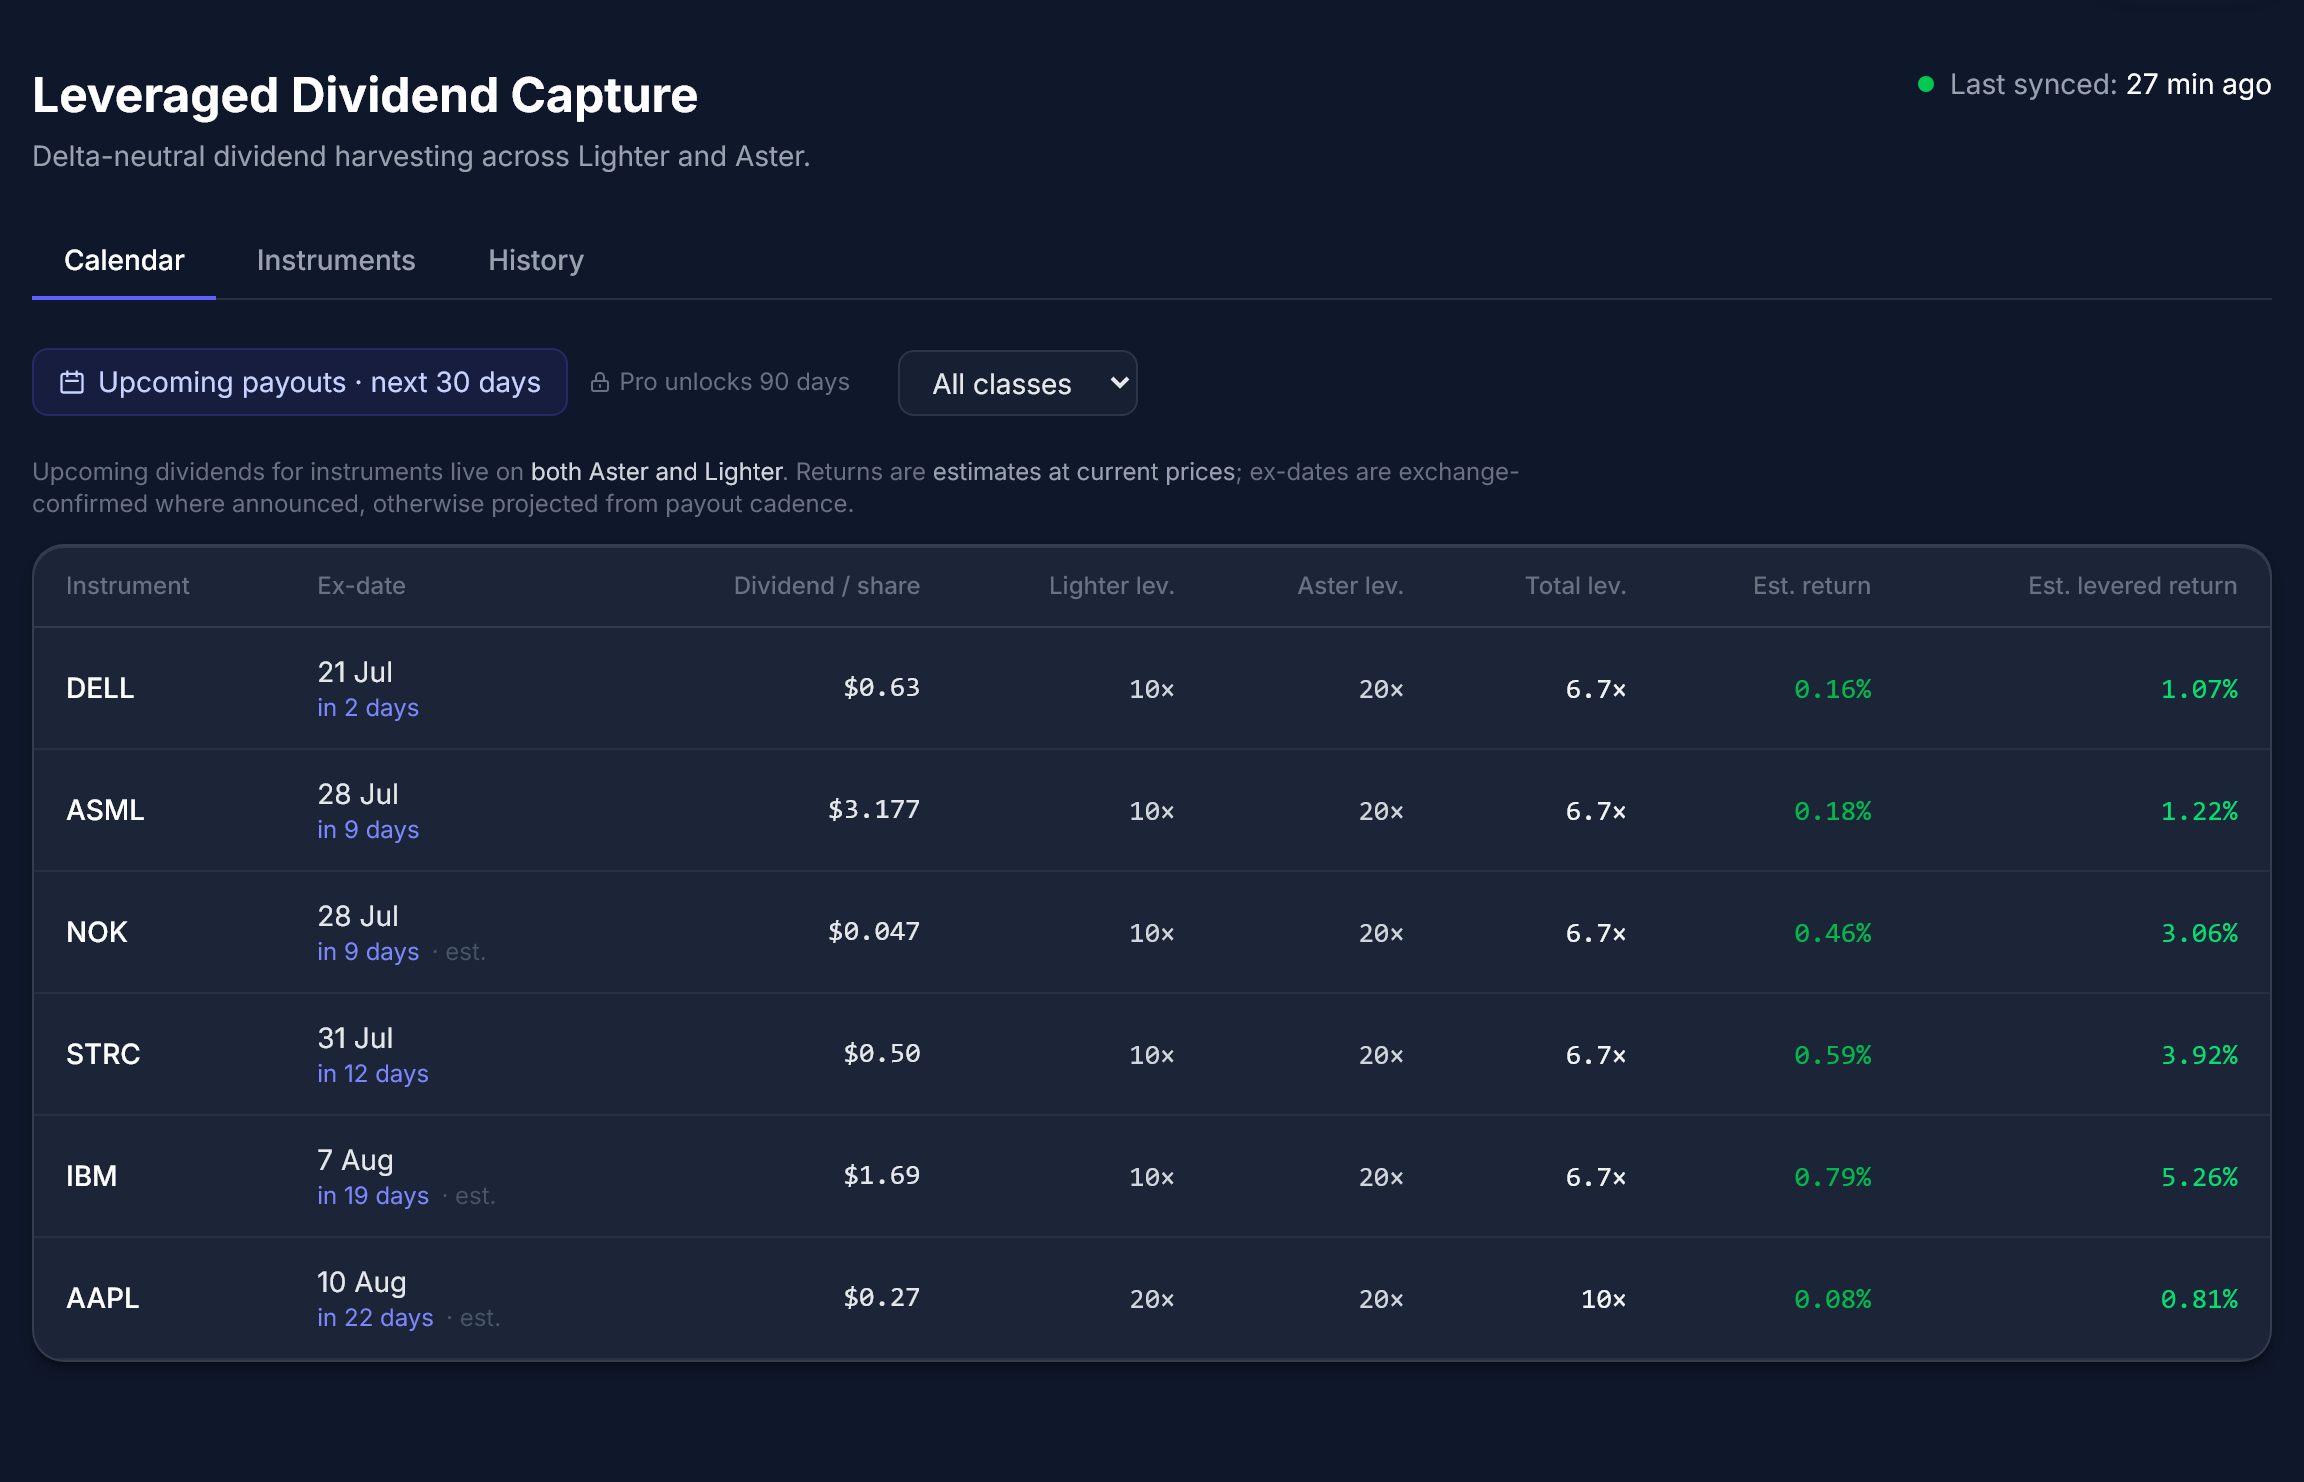
A status line at the top shows when the universe was last synced. Below it are three tabs — Calendar, Instruments, and History — and a header that names the strategy: delta-neutral dividend harvesting across Lighter and Aster.
> Returns and the leverage breakdown require a free account. Signed out, you see the next 7 days and the payout dates; sign in to unlock the returns, the leverage columns, and the 30-day horizon.
The Calendar Tab: Upcoming Payouts
The Calendar is the heart of the tool — every upcoming dividend on an instrument that trades on both venues, sorted by ex-date with the nearest on top. Each row has eight columns:
Everything in the return columns is an estimate at current prices — the header says so. Use the All classes filter to narrow to stocks or ETFs, and note the horizon badge: free sees the next 7 days, a signed-in account sees 30 days, and Pro extends it to 90 days.
The Instruments Tab: The Dividend-Paying Universe
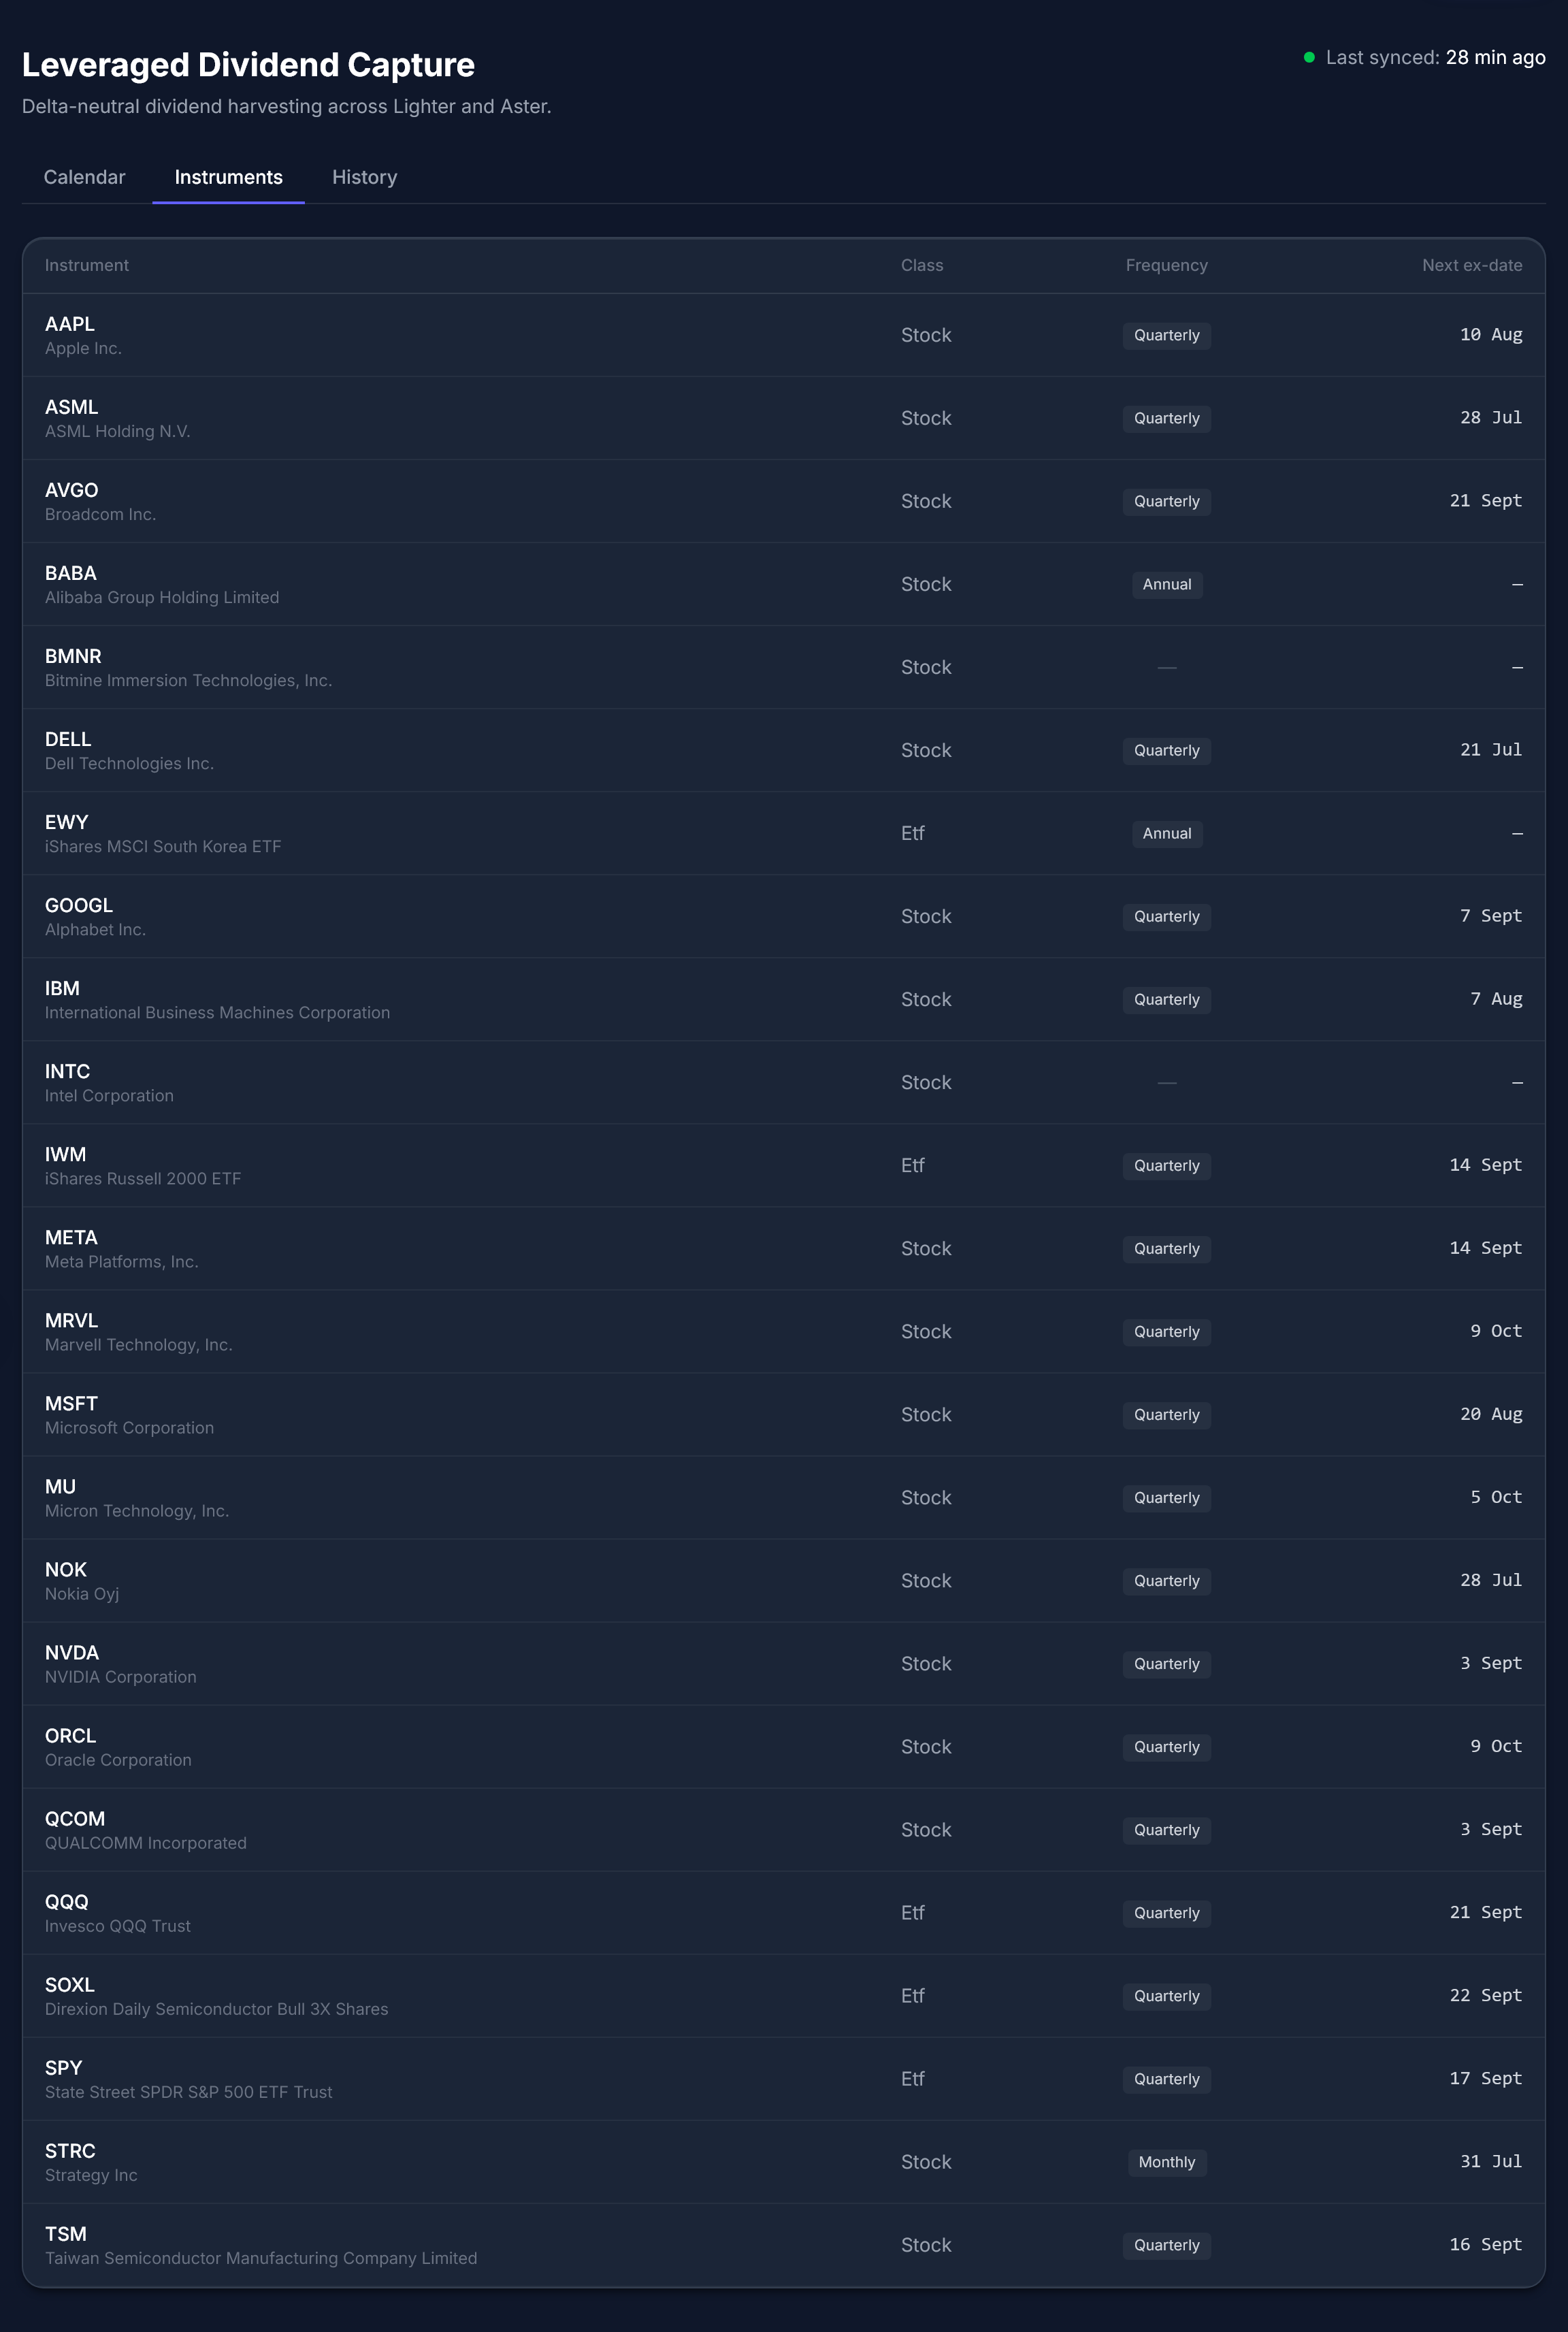
The Instruments tab is the base the Calendar draws from: the full list of instruments that are listed on both Aster and Lighter and pay a dividend. (The raw intersection of the two venues is ~170 instruments, most of them crypto that pays nothing — those are filtered out, so this list stays focused on what the strategy can actually use.)
Four columns: the Instrument (ticker and full name), its asset Class (stock or ETF), the payout Frequency, and the Next ex-date. The frequency — monthly, quarterly, semi-annual, or annual — is derived from the instrument's own observed history of ex-dates, so it reflects what the issuer actually does. Where the history is too sparse to be sure (a name that recently suspended or started its dividend), the cell shows a dash rather than a guess.
The History Tab: Payouts That Actually Landed
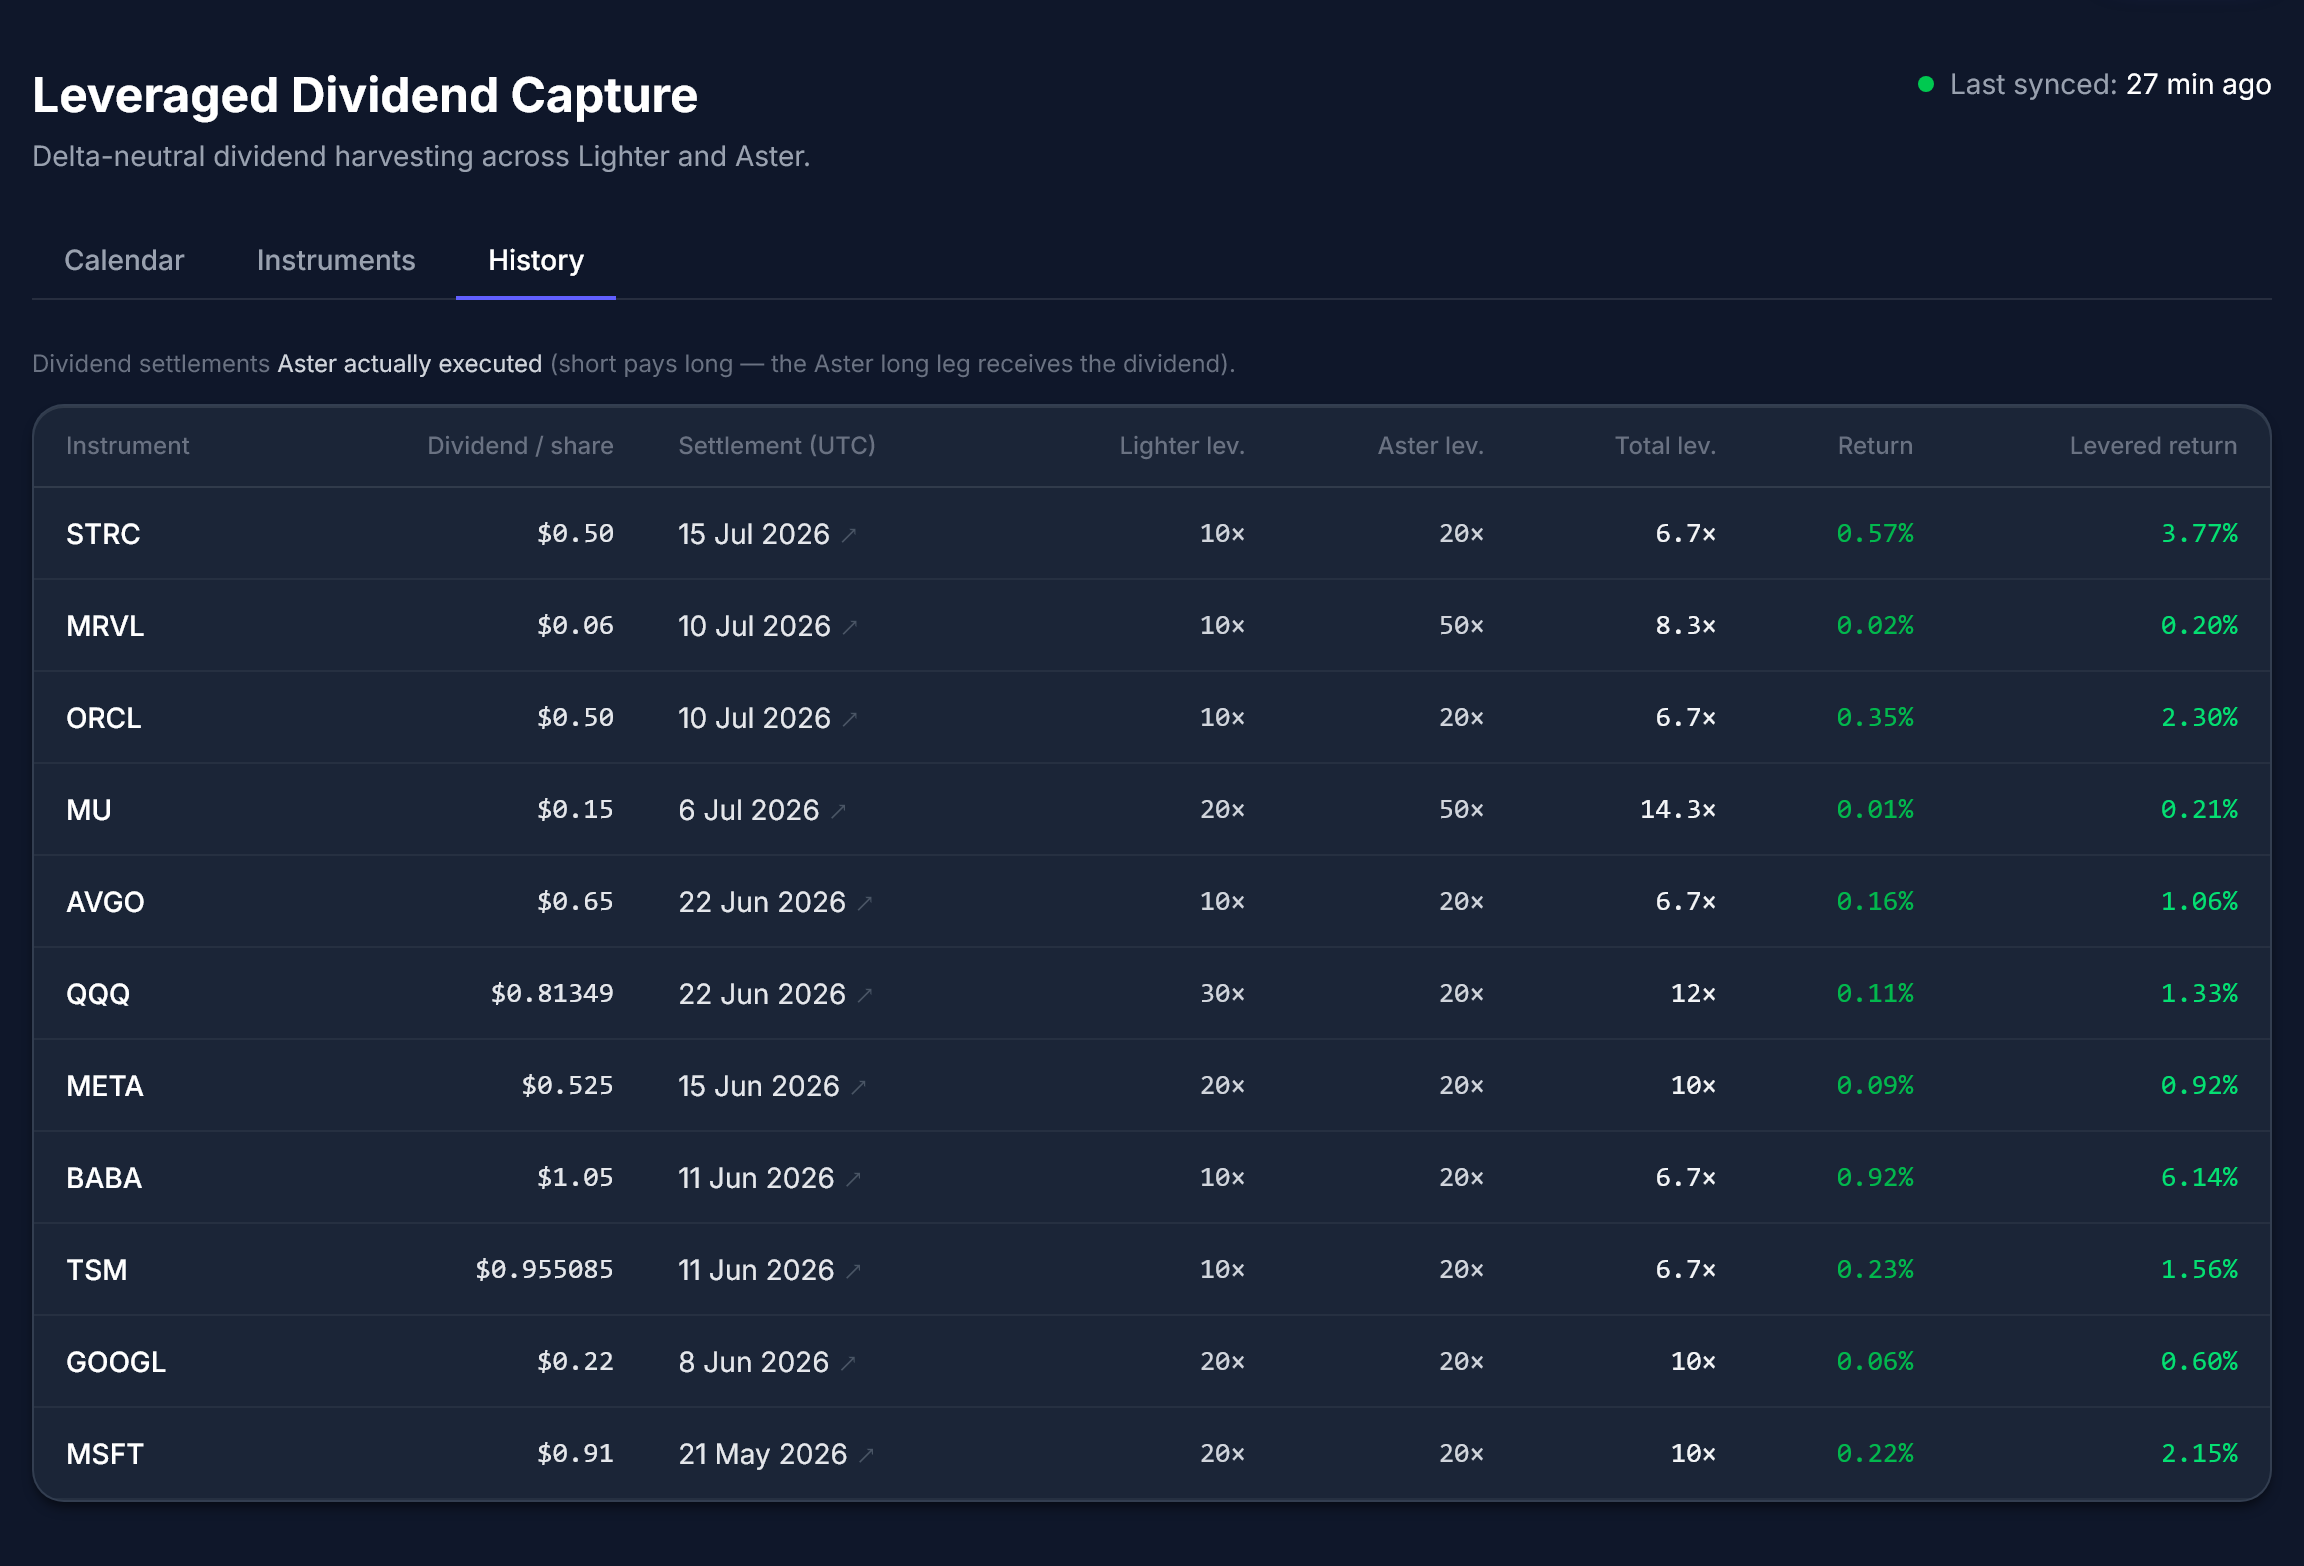
The estimates in the Calendar are only as good as the assumption that Aster really pays the dividend to the long side. The History tab is the evidence: dividend settlements Aster actually executed (short pays long — the Aster long leg receives the dividend), parsed from Aster's own announcements.
Each row shows the Dividend / share Aster paid, the Settlement (UTC) timestamp (linked to the announcement), the same Lighter / Aster / Total leverage breakdown, and the realized Return and Levered return. This is where you confirm an instrument's dividend-handling before you trust its forecast — ORCL, MSFT, META, AVGO, TSM and others all appear here with real payouts. An instrument that shows up in History with a clean payout is one whose Calendar estimate you can lean on.
How the Data Is Built
What's Free and What's Pro
| Tier | What you get |
|---|---|
| Free (signed out) | Calendar for the next 7 days; full Instruments list; ex-dates and dividend amounts |
| Registered (free account) | 30-day Calendar horizon; per-event returns and leverage on the Calendar; full settlement History returns |
| Pro | 90-day Calendar horizon |
Practical Tips
Estimates don't include fees or the entry/exit spread. The real edge is the dividend minus the cost of getting into and out of the pair — and the spread between the two venues at those moments can eat part of it. Treat the levered return as the ceiling, not the take-home.
Confirm the payout before you commit. The whole strategy rests on Aster crediting the dividend to the long and Lighter not clawing an equivalent amount off the short. Use the History tab to verify an instrument has actually settled that way before trading its forecast.
Leverage is liquidation risk, not price risk. The pair is delta-neutral, so direction is hedged — but a sharp move can still liquidate one leg if its margin is thin. Choose leverage you can hold through volatility, and watch the margin on the lower-leverage leg (usually the binding one).
It's two venues. Running the pair means margin, fees, and funding intervals on both Aster and Lighter. Funding cadence can differ between them, which affects how the (unmodelled) funding leg accrues.
"· est." means approximate. A projected ex-date is a best guess from cadence; treat it as a placeholder until the exchange confirms the real date.
How DNDC Differs From the Other Tools
The Funding Rate Scanner finds positive funding on a single venue, and Cross Exchange Funding Arbitrage finds the funding spread between two venues. DNDC shares their delta-neutral DNA but harvests a different cash flow entirely: the dividend credited to an Aster long, hedged by a Lighter short. If you're new to the market-neutral idea, start with Funding Rate Arbitrage: A Market-Neutral Crypto Strategy.
Summary
Leveraged Dividend Capture turns "which tokenized stocks pay a dividend I can hedge, and what's it worth?" into a single ranked calendar. Read the Calendar for upcoming payouts and their leverage-amplified returns, use Instruments to see the whole dividend-paying universe and its cadence, and check History to confirm which payouts Aster has really executed before you put capital on both legs.
Start at Decentralise.com/dividend-calendar.