How to Use Cross Exchange Funding Arbitrage (CEFA)
A step-by-step guide to comparing perpetual funding rates between two exchanges and finding delta-neutral, market-neutral spreads you can short on one venue and long on the other.
The Cross Exchange Funding Arbitrage tool — CEFA — compares the funding rate of the same asset on two different exchanges and surfaces the instruments where the gap between them is wide and consistent. Where the Funding Rate Scanner tells you where funding is positive on a single venue, CEFA answers a different question: which asset pays the most if I short the perpetual on one exchange and long it on another?
That short-here / long-there structure is what makes the strategy market-neutral. You hold the same size on both legs, so price moves cancel out, and your profit comes from the difference between the two funding rates. This guide walks through every control so you can find and evaluate those spreads.
> Like the Scanner, CEFA reads live exchange data and requires a free account. Sign in to load the table. Periods up to 60 days are available once you're signed in; the 90-day range is reserved for Pro.
What You'll See When You Open CEFA
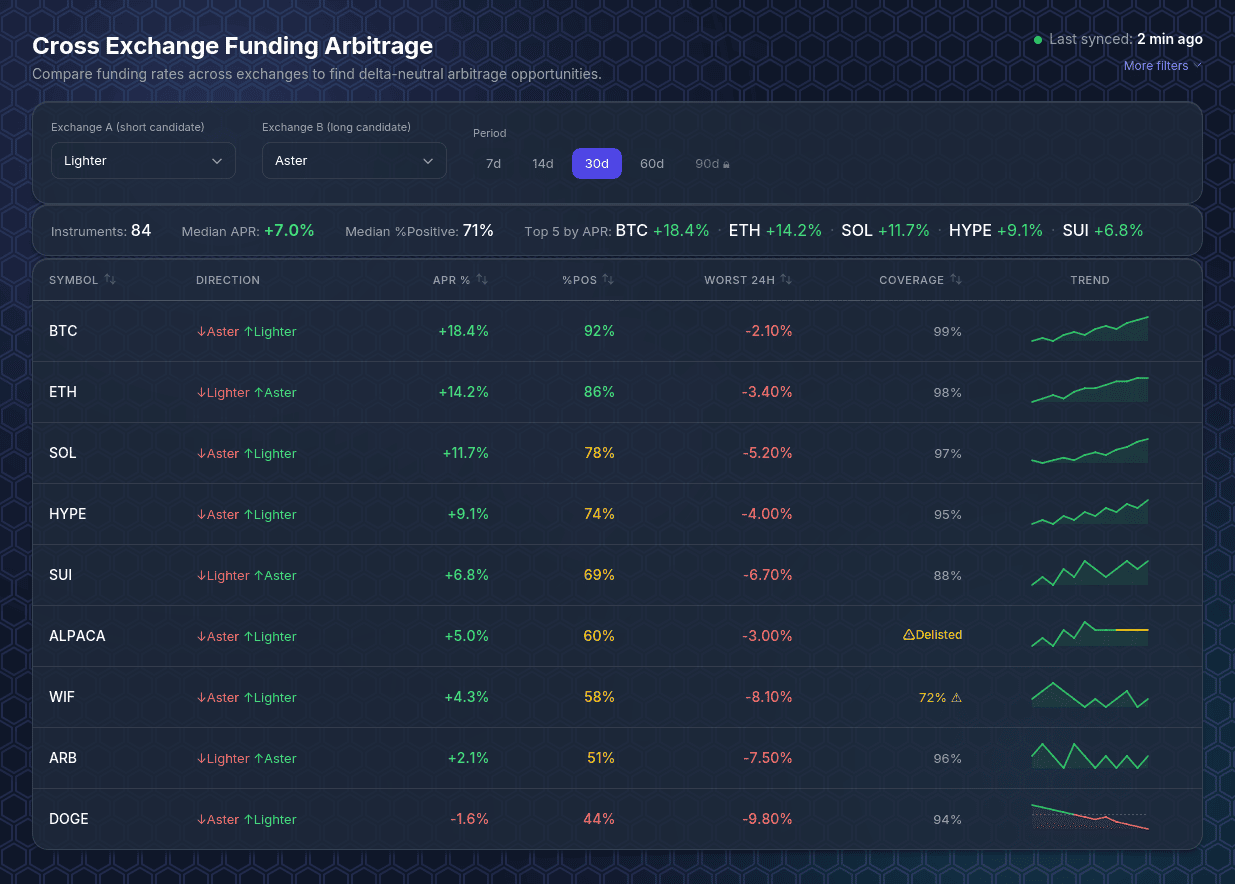
At the top, a status line shows when the data was last synced and a More filters toggle. Below it sit three areas: the controls (which two exchanges to compare and over what period), a summary bar with at-a-glance statistics, and the main table — one row per asset that trades on both selected exchanges, sorted by APR from highest to lowest.
The summary bar gives you the shape of the current pair at a glance: how many instruments the two exchanges have in common, the median APR and median %Positive across them, and the Top 5 by APR.
Each table row has seven columns:
Step 1: Choose the Two Exchanges
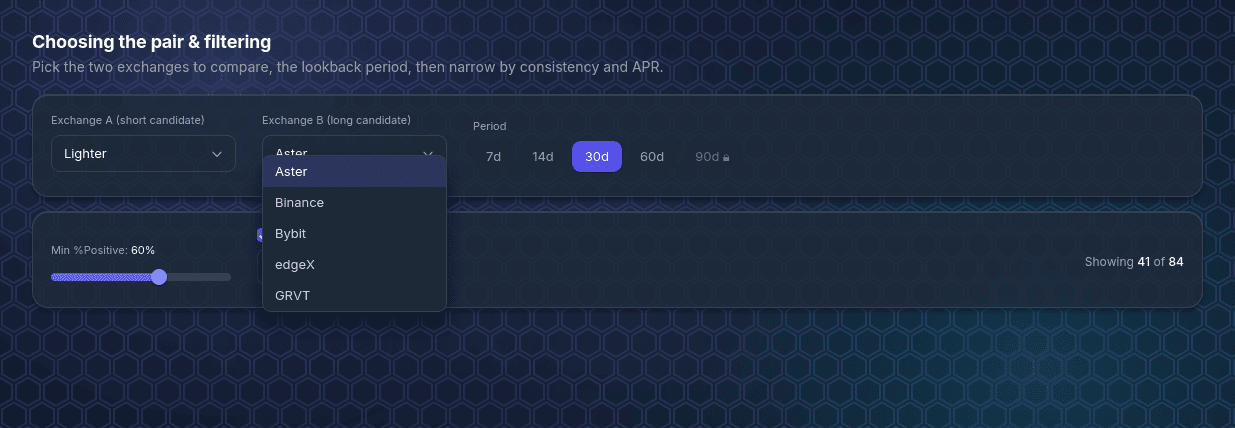
Set Exchange A (short candidate) and Exchange B (long candidate). These are simply the two venues you want to compare — an exchange selected as A can't also be picked as B. You don't need to guess the right side for each asset: the table's Direction column shows the profitable orientation per instrument, which may differ from one row to the next.
A natural starting pair is two venues where you already hold balances, since running the strategy means posting margin on both.
Step 2: Set the Period
The Period switcher controls the lookback window for every metric. Shorter windows (7d) reflect current conditions; longer windows (30d, 60d) reveal which spreads are durable rather than momentary. As with the Scanner, a good habit is to find candidates on a longer window, then drop to 7d to confirm the spread is still open today. Your exchange pair and period are remembered between visits.
Step 3: Read the Summary Bar
Before diving into individual rows, glance at the summary. A healthy median APR and median %Positive tell you the pair is broadly productive; a low or negative median says most of these instruments aren't worth shorting against each other right now, and you should either tighten your filters or try a different exchange pair.
Step 4: Filter by Consistency and APR
Click More filters to reveal two controls:
A counter shows how many instruments remain out of the total, and a Reset link clears the filters.
Step 5: Read the Table
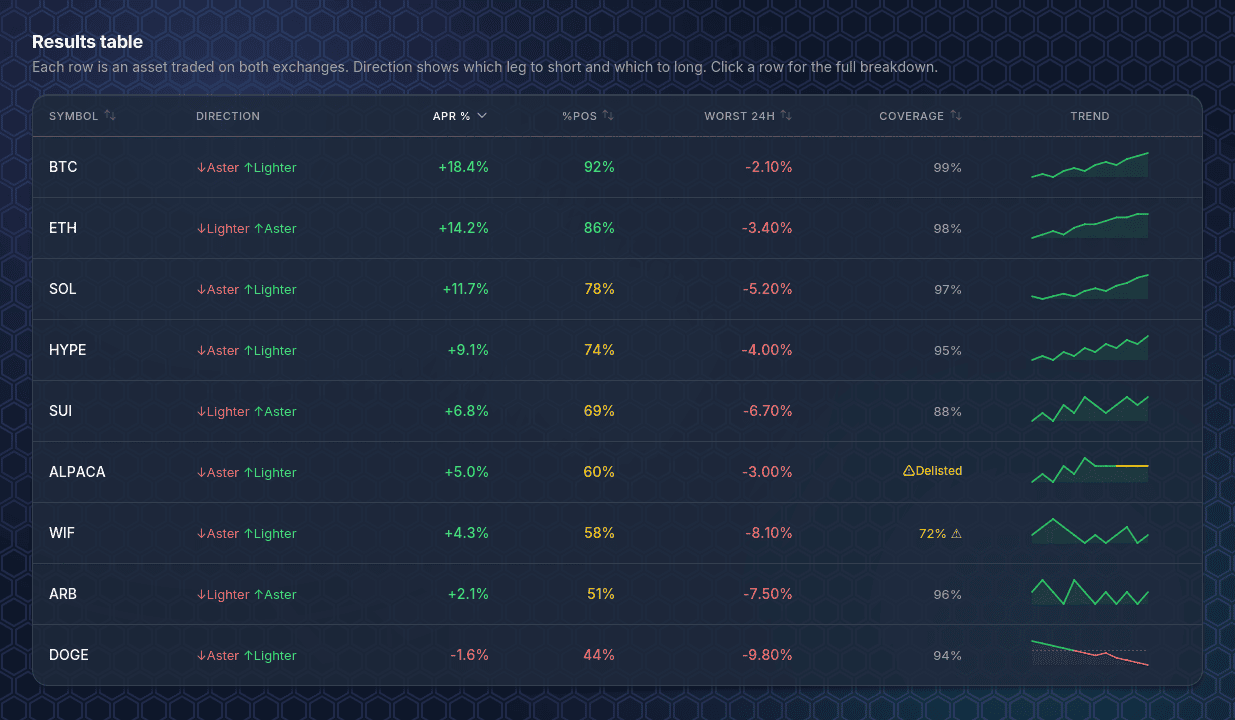
This is where you separate real opportunities from noise. A strong candidate has a healthy APR %, a green %Pos, a Worst 24h you can stomach, and Coverage at or near 100%. Treat anything with low coverage (yellow ⚠) cautiously — the spread may look attractive simply because there isn't enough overlapping data to contradict it. Rows with insufficient data are dimmed and can't be opened.
Step 6: Sort the Table
Click any sortable header to reorder. The table opens sorted by APR % descending, but the other columns are often more revealing: sort by %Pos to lead with the most consistent spreads, by Worst 24h to find the calmest ones, or by Coverage to push the thin-data rows out of the way.
Step 7: Open an Instrument's Detail
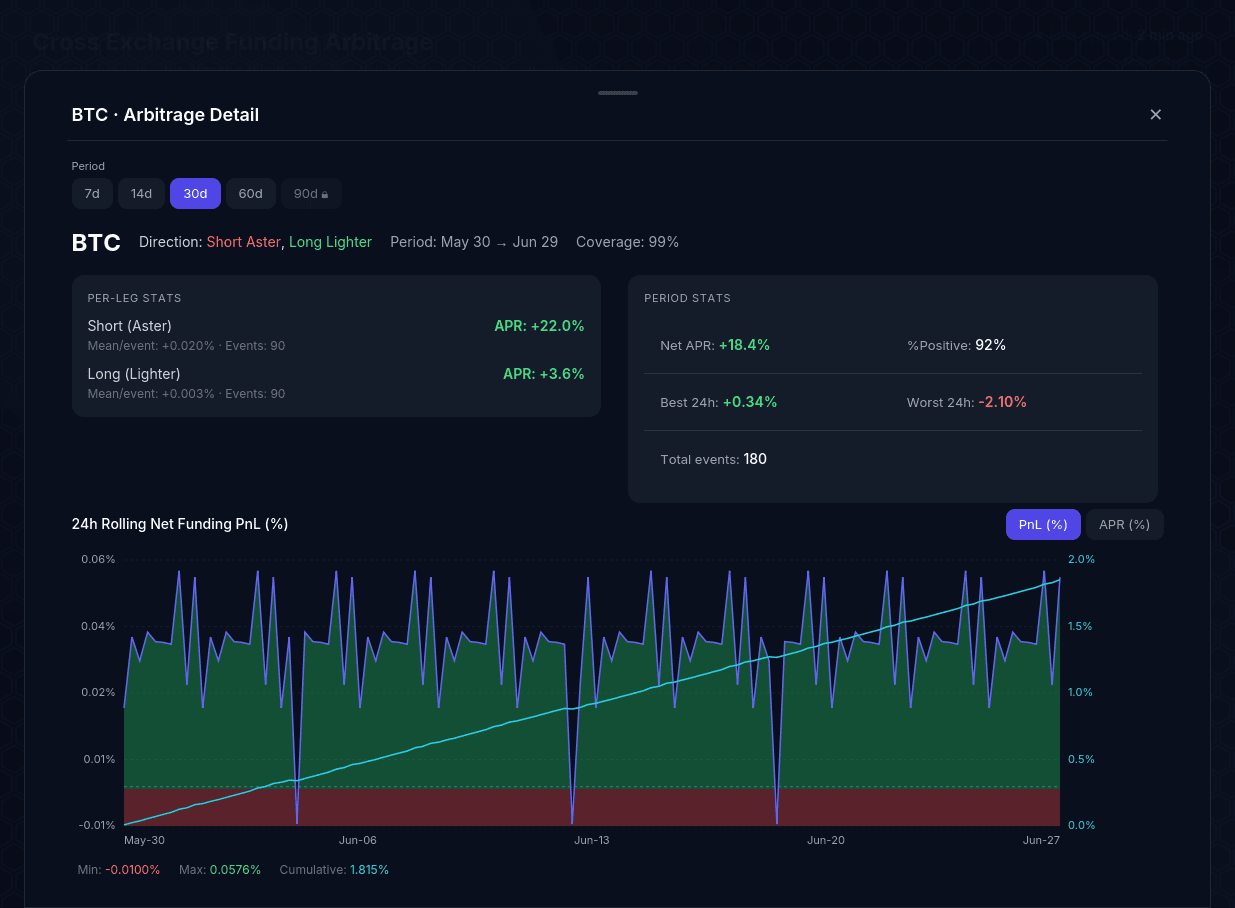
Click any row to open its detail drawer. This is the full breakdown behind the headline APR.
Per-leg stats show each side on its own: the APR contributed by the short leg and by the long leg, the mean funding per event, and how many events occurred. Seeing both legs makes it obvious where the spread comes from — usually one venue paying strongly positive funding while the other sits near zero.
Period stats summarize the combined position: Net APR, %Positive, Best 24h, Worst 24h, and Total events, alongside the effective date range and coverage.
The 24h Rolling Net Funding chart is the centerpiece. The shaded area is the rolling net result (green where the spread paid you, red where it inverted), and the cyan line is cumulative net funding. A cumulative line that climbs steadily is exactly what you want — it means the spread has been a durable earner, not a one-off spike. You can switch the chart between PnL (%) and annualized APR (%), and the footer reports the Min, Max, and final Cumulative for the window.
Practical Tips
APR here is a spread, not a single rate. A row's return depends on both legs. A high short-leg rate can be eaten up by an equally high long-leg cost, so always open the detail to see how the two sides combine.
Coverage is a trust signal. Below 80%, the APR and %Positive are computed on partial data. Prefer instruments with near-full coverage, or at least size them down until you've watched them longer.
Use Worst 24h for risk, not just APR for reward. A spread that averages well but has a brutal worst-24h can still force an uncomfortable rebalance. Sorting by Worst 24h surfaces the steadier opportunities.
Validate with the cumulative line. In the detail chart, a smooth rising cyan line is a durable spread; a jagged line with large red stretches means the edge inverts often and is harder to hold.
Remember it's two exchanges. Cross-exchange means margin, fees, and counterparty risk on both venues. Funding intervals can also differ between exchanges, which affects how often each leg settles — factor that into execution.
How CEFA differs from the other tools. The Funding Rate Scanner finds positive funding on a single venue (the raw material for a spot-and-perp position). CEFA finds the spread between two venues for a perp-vs-perp position. If you're new to the underlying idea, start with Funding Rate Arbitrage: A Market-Neutral Crypto Strategy, and use the Funding Rate Arbitrage Backtester to test a single-exchange variant on historical data.
Summary
CEFA turns "which two venues, and which asset, pay the best funding spread?" into a single ranked view. Choose your exchange pair and period, filter by consistency and APR, read the Direction column to know which side to short and which to long, and open the detail drawer to confirm the spread is steady before committing capital on both legs.
Start comparing at Decentralise.com/funding-arbitrage.