How to Use the Funding Rate Scanner
A step-by-step guide to finding perpetual instruments with consistently positive funding rates across exchanges — filter by period, consistency, APR, and spot availability.
The Funding Rate Scanner on Decentralise.com scans perpetual funding rates across multiple exchanges in real time and ranks the instruments that have been paying the most consistent funding. If you run — or want to run — a market-neutral funding strategy, this is where you start: instead of opening six exchange apps and eyeballing rates one by one, you get every perpetual in a single sortable table, scored by how reliably its funding stays positive.
This guide walks through every control on the Scanner so you can quickly surface the instruments worth a closer look.
> The Scanner reads from live exchange data, so it requires a free account. Sign in to load the table. Periods up to 60 days are available once you're signed in; the 90-day range is reserved for Pro.
What You'll See When You Open the Scanner
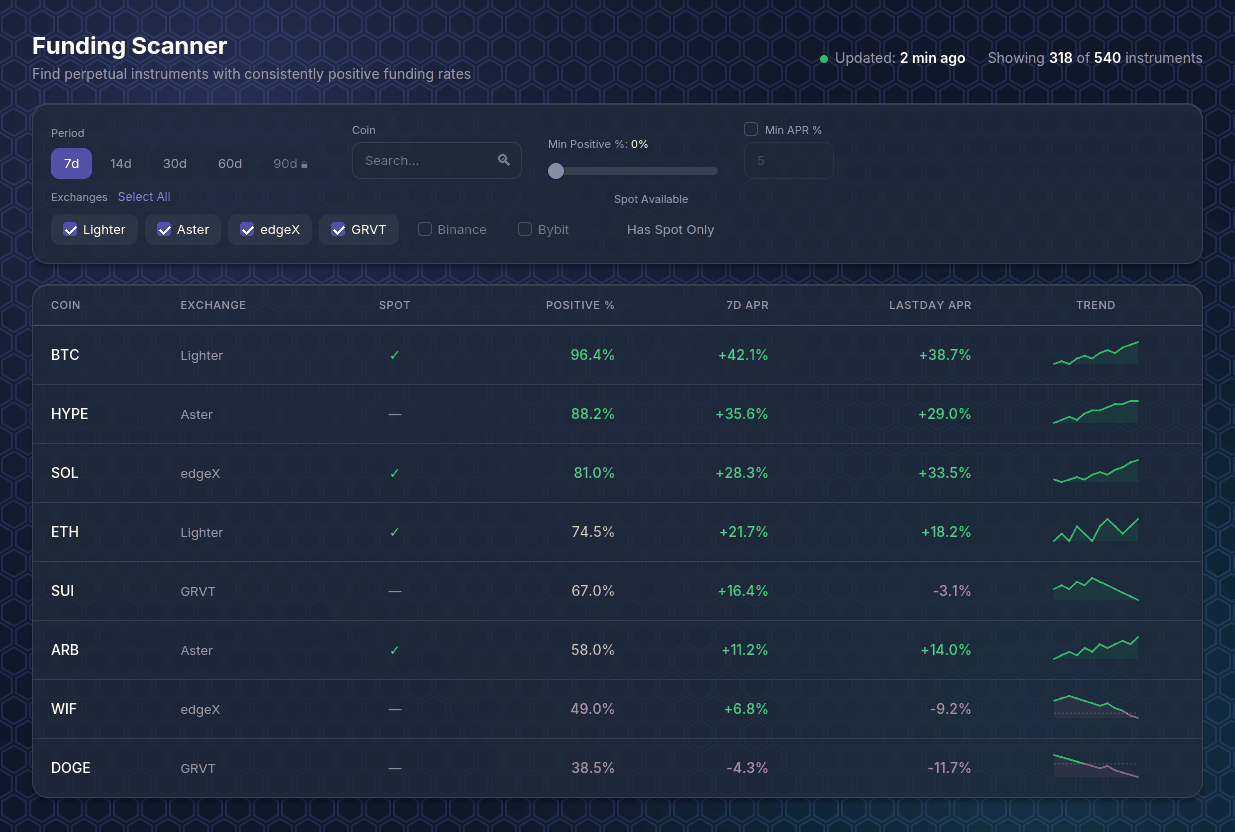
At the top you'll find a status line: a green dot with the last sync time ("Updated: 2 min ago") and a counter showing how many instruments match your current filters out of the total tracked. Below the filter panel sits the main table — one row per perpetual instrument, sorted by APR from highest to lowest by default.
Each row contains seven columns:
Step 1: Choose the Period
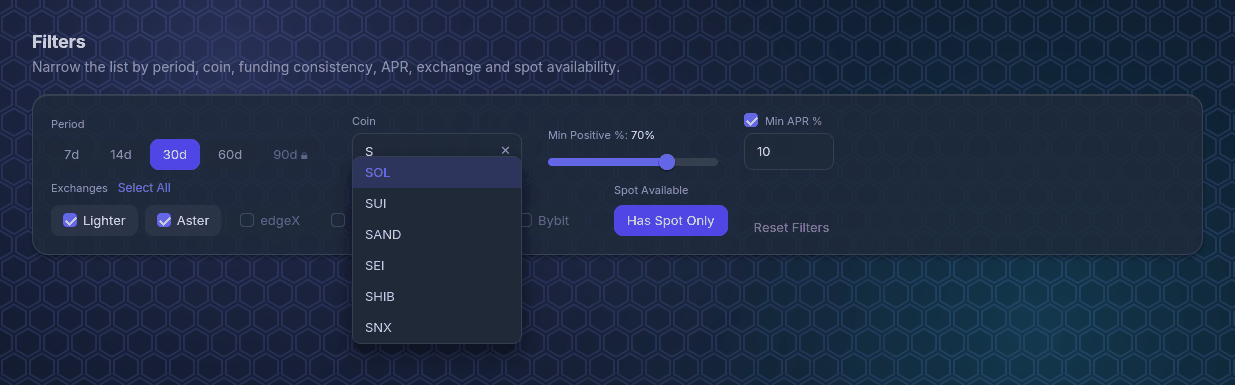
The Period switcher sets the lookback window for every metric in the table. A short window like 7d reacts quickly to current conditions; longer windows like 30d or 60d smooth out noise and show you which instruments pay consistently rather than just spiking once.
A good habit is to scan on a longer period to find candidates with a stable history, then drop to 7d to confirm the rate is still healthy today.
Step 2: Search by Coin
The Coin field is a searchable dropdown. Start typing a ticker — `BT`, `SOL`, `ETH` — and the list narrows to matching assets. Pick one to filter the table down to that asset across every selected exchange, which is the fastest way to compare the same coin's funding on Binance versus Lighter versus Aster. Clear the field with the × button to return to the full list.
Step 3: Select Exchanges
The Exchanges row lets you toggle individual venues on and off. By default the Scanner focuses on Lighter, Aster, edgeX, and GRVT; tick Binance or Bybit to bring the major centralized venues into the comparison, or use Select All / Deselect All to switch the whole set at once. Your exchange selection (and the period) are remembered between visits.
Step 4: Filter by Consistency and APR
Two filters help you cut a long list down to genuinely promising instruments:
Used together, these answer the real question behind the strategy: which instruments pay a worthwhile rate, consistently?
Step 5: Spot Available Toggle
Flip Has Spot Only on to show only assets that also have a spot market. If your plan is to hold the asset on spot and short the perpetual to collect funding, you need that spot market to exist — this toggle removes perps you couldn't easily hedge.
When any filter is active, a red Reset Filters link appears to clear everything back to defaults in one click.
Step 6: Sort the Table
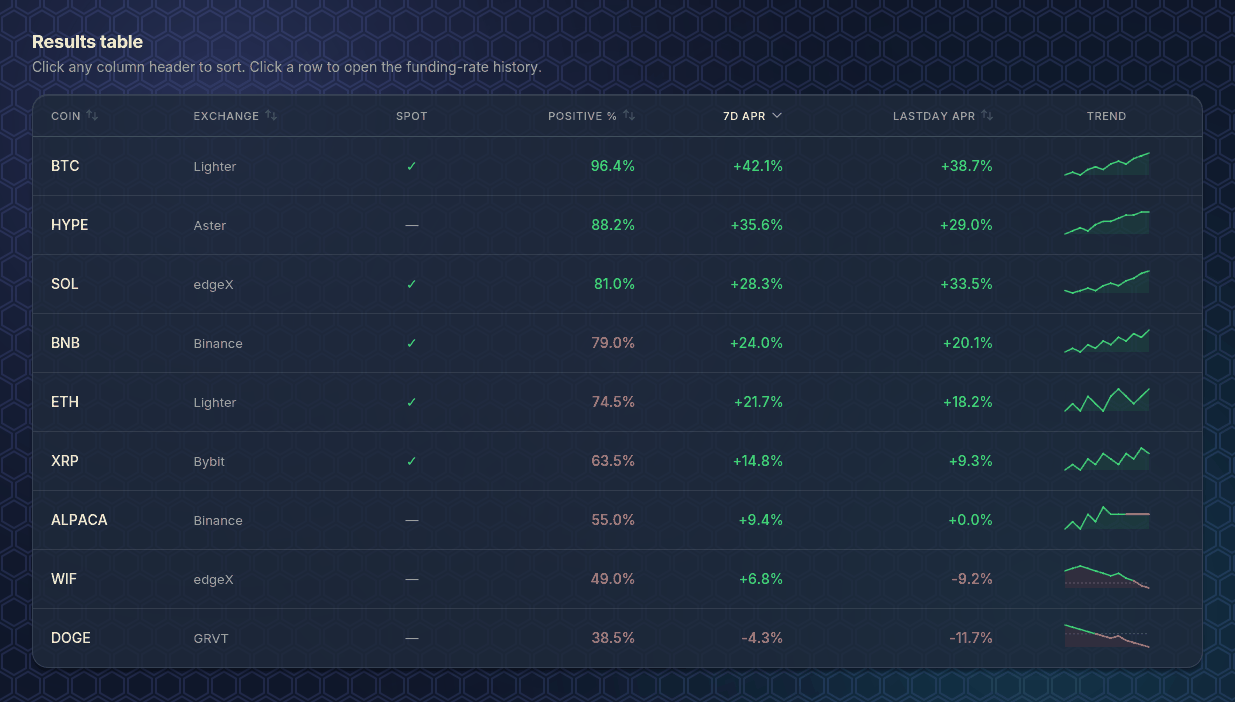
Click any column header to sort by it; click again to flip the direction. The table opens sorted by APR descending, but sorting by Positive % is often more useful — a slightly lower APR that pays 95% of the time can be far more attractive than a higher headline rate that only holds half the time.
Watch the colour cues as you scan: green Positive % values are the consistent payers, and a yellow sparkline tail marks an instrument that has been delisted, so its recent history isn't actionable.
Step 7: Open an Instrument's Funding History
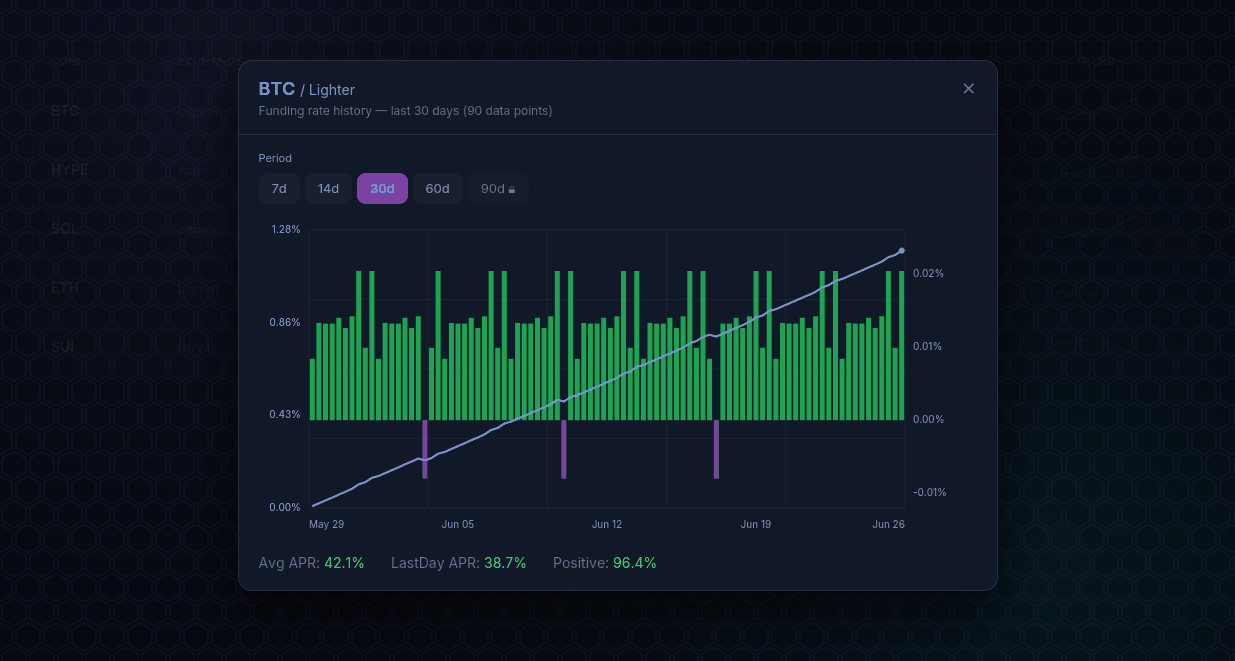
Click any row to open its funding-rate history. The chart plots every funding payment in the period as a bar — green for positive, red for negative — while the indigo line tracks cumulative funding, so a steadily rising line is exactly what you want to see. You can switch the period inside the modal to zoom in or out, and the footer recomputes the headline stats for whatever window you choose: Avg APR, LastDay APR, and Positive %.
This view is where you separate a genuinely steady earner from one whose average was propped up by a few large spikes. A high APR built on a smooth, rising cumulative line is reliable; the same APR built on a couple of vertical jumps surrounded by flat or negative stretches is not.
Practical Tips
Lead with consistency, not the headline rate. Positive % is the column that tells you whether an opportunity is repeatable. A green 90%+ instrument with a moderate APR usually beats a red 45% instrument with a flashy one.
Cross-check LastDay against the period APR. If LastDay APR is far below the period APR, the rate is cooling off and the historical number may be stale. If it's holding or higher, momentum is on your side.
Mind the Spot column. Funding strategies that buy spot and short the perp need a spot market. The "Has Spot Only" toggle keeps the list to instruments you can actually hedge.
Use the chart to validate. Before committing, open the funding history and look at the cumulative line. Smooth and rising is good; jagged with deep red stretches is a warning.
Compare the same coin across venues. Filtering by a single coin with several exchanges enabled reveals where a given asset pays best — and sets up the next question.
From scanning to acting. The Scanner finds where funding is positive. To test whether a single-exchange spot-and-perp position would have been profitable on historical data, use the Funding Rate Arbitrage Backtester. To compare funding between two exchanges and find delta-neutral cross-exchange opportunities, use the Cross Exchange Funding Arbitrage tool. New to the strategy itself? Start with Funding Rate Arbitrage: A Market-Neutral Crypto Strategy.
Summary
The Funding Rate Scanner turns a scattered, multi-exchange chore into a single ranked view. Set a period, narrow by coin, exchange, consistency, APR, and spot availability, sort by what matters to you, and open any instrument's history to confirm the funding is as steady as the numbers suggest.
Start scanning at Decentralise.com/scanner.